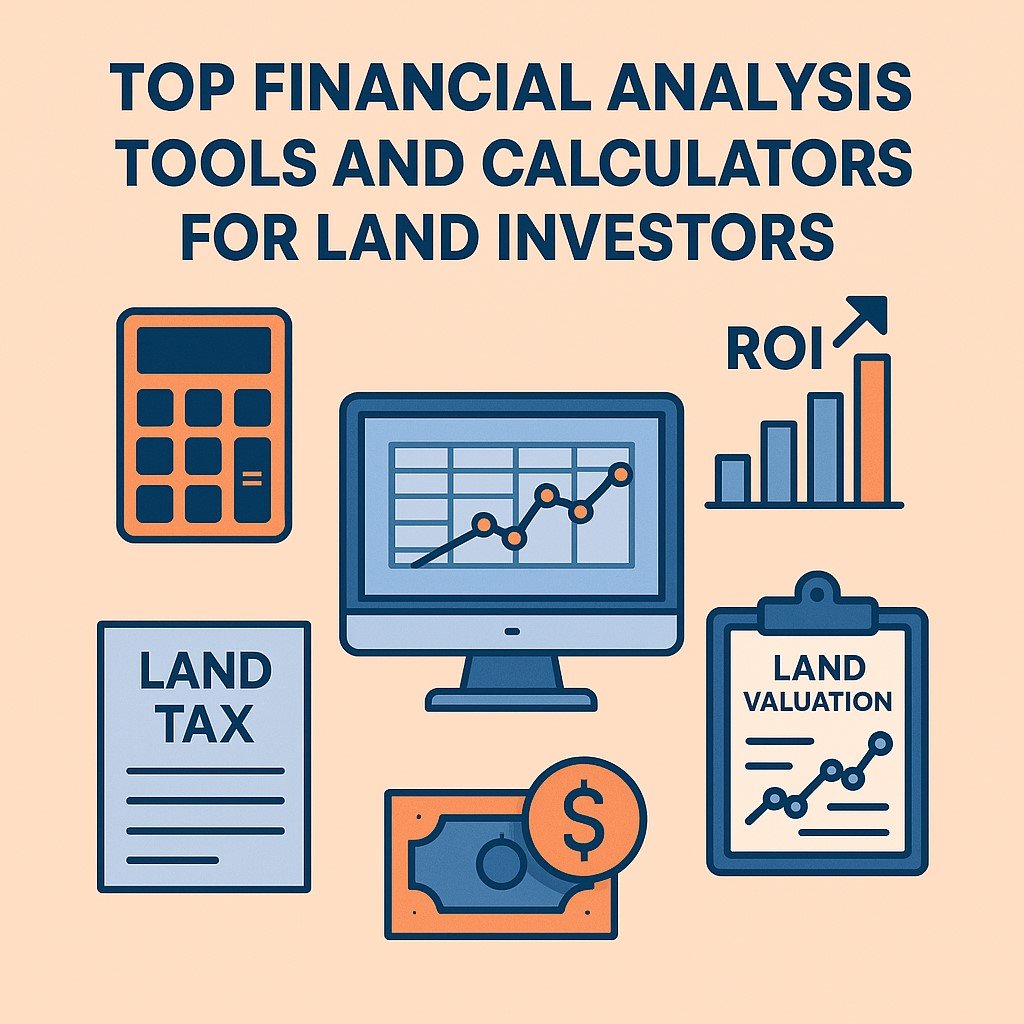
When you invest in raw land, accurate forecasts can make or break your returns. In this guide, you’ll find a curated selection of calculators and downloadable spreadsheets—from investment ROI models and land tax estimators to valuation tools and pipeline trackers—so you can analyze every deal, manage financing, and maximize profit.
What land investment calculator should I use?
You should choose a calculator that lets you input purchase price, holding costs, financing terms, and projected sales value while delivering key metrics like cash-on-cash return, internal rate of return, and net profit so you can compare multiple deals side by side.
Key Input Variables
Begin by entering your purchase price, closing costs, property taxes, insurance, and holding period expenses. Include financing details such as down payment, interest rate, and loan term. Accurate inputs ensure your calculator outputs are reliable.
Output Metrics
Look for calculators that provide cash-on-cash return, IRR, net present value, and total profit. These metrics show how quickly you recoup your investment, the overall profitability, and whether a deal meets your minimum return thresholds.
📘 Get Your FREE Land Investing Strategy Guide
Discover how savvy investors build passive income with vacant land.
Customization Options
A good tool lets you adjust assumptions—like sale price growth rate or exit costs—and instantly see how projections change. Templates in Excel or Google Sheets that include built-in formulas let you tailor the model to your deal structure.
How do I calculate land tax for an investment property?
You should gather your parcel’s assessed value, current local tax rate, and any applicable exemptions, then multiply the assessed value by the rate and subtract deductions so you arrive at an accurate annual tax liability.
Identifying Tax Rates
Locate your county assessor’s website and find the most recent tax rate expressed in mills or percentages. Rates can vary by zoning classification and special districts, so confirm you’re using the correct figure for investment land.
Estimating Annual Liability
Multiply the assessed value of the land by the tax rate. For example, if your land is assessed at $100,000 and the rate is 1.5 percent, your annual tax would be $1,500. Round up or down according to local billing rules.
Assessing Deductions and Exemptions
Check for exemptions such as agricultural use abatements or homeowner credits that apply to vacant land held for specific purposes. Subtract any eligible deduction amounts from your calculated liability to determine the net tax you owe each year.
How can I value raw land using a spreadsheet?
You should compile comparable sales data, cost‐based replacement values, and potential income projections into separate tabs, then apply formulas to calculate average price per acre, replacement cost, and capitalization rates so you can triangulate an accurate market value.
Comparable Sales Method
Enter sale dates, prices, acreage, and location for at least five similar parcels. Calculate price per acre for each comp and use an average or weighted average to establish a baseline value.
Cost Approach Method
List estimated expenses to replicate or prepare the land—site clearing, utility hookups, grading, and add any soft costs such as permitting. Sum these costs and adjust for depreciation or obsolescence to determine land worth.
Income Approach Method
If the land can generate lease or farming income, project annual net operating income and divide by the market cap rate for similar properties. This yields a value based on income potential rather than just sales comparables.
How do I use a residual land valuation spreadsheet?
You should input projected development revenues, subtract all hard and soft development costs, financing expenses, and a developer profit margin, then let the spreadsheet calculate residual land value so you know the maximum land price that delivers your target returns.
Defining Residual Value
Set up a cell for expected gross sales revenue based on final lot sales prices or built asset values. This becomes your top‐line input for the model.
Inputting Development Costs
Create line items for site preparation, infrastructure, permits, and professional fees. Include contingency reserves and financing interest. Sum these costs to feed into the residual formula.
Calculating Profit Margin
Decide on a target developer profit percentage. Multiply total costs by this percentage and add the result back into the cost base. Subtract the total from projected revenue to reveal the land’s residual value.
How do I calculate a land flip ROI in Excel?
You should list each cash outlay and inflow in chronological order, use Excel’s XIRR function to compute your internal rate of return, and calculate cash‐on‐cash return by dividing net profit by your actual cash invested so you can benchmark deal performance.
Setting Up Cash Flows
In column A, input dates of each transaction. In column B, list negative values for purchase, rehab, and holding costs, and positive values for sale proceeds and reimbursements.
Applying Excel Formulas
Use =XIRR(values, dates) to calculate the annualized IRR. For cash‐on‐cash, sum all positive and negative cash flows to determine net profit, then divide by total cash invested and format as a percentage.
Interpreting IRR and ROI
An IRR above your hurdle rate indicates a viable flip. Cash‐on‐cash return shows how quickly your investment is recovered. Compare these metrics across deals to prioritize the most profitable opportunities.
How do I model seller financing with an amortization spreadsheet?
You should input the loan amount, interest rate, term length, and payment frequency, then use amortization formulas to generate a schedule of principal and interest payments so you can project monthly cash flow and outstanding balance over time.
Inputting Loan Terms
Enter the principal amount financed by the seller, annual interest rate, number of years, and number of payments per year. Reserve cells for balloon or interest‐only options if needed.
Generating Amortization Schedule
In each row, calculate interest as previous balance times rate divided by payments per year. Compute principal as total payment minus interest. Deduct principal from prior balance to get new balance.
Analyzing Cash Flow
Sum interest and principal payments by month or year to see total cash received. Chart the declining interest portion versus rising principal payoff so you understand how revenue and equity evolve over the loan term.
How can I estimate land flipping profits?
You should forecast total sales revenue, deduct acquisition, holding, improvement, and selling costs, then subtract financing fees and a profit‐share reserve so you can calculate net profit and ensure the deal meets your return requirements.
Revenue Projections
Estimate final sale price based on market comparables or planned improvements. If selling in phases, schedule multiple revenue entries by expected closing dates.
Expense Breakdown
Itemize purchase price, closing costs, taxes, insurance, site preparation, marketing, and broker fees. Include holding costs such as property taxes and utilities over the holding period.
Net Profit Analysis
Sum all expenses and financing charges, then subtract from total revenue. Divide net profit by total cash invested to calculate return on investment and compare against your minimum acceptable yield.
How do I use a land wholesaling calculator?
You should enter your assignment fee, acquisition costs, repair estimates, and expected resale price, then let the calculator compute your net assignment profit so you can determine whether the deal warrants a wholesale agreement or double‐closing structure.
Wholesale Fee Inputs
Input the fee you plan to collect from the end buyer as your wholesaling revenue. Include deposit and nonrefundable fees if applicable.
Assignment vs Double Closing
Create toggles or separate sheets for assignment deals and double closings. Compare transaction costs like funding or warehousing fees for double closings versus assignment commissions.
Profit Split Modeling
If partnering with other investors or splitting fees with agents, add cells to allocate percentages. Review multiple scenarios to identify the optimal split that still meets your profit targets.
How can I analyze land comps in a spreadsheet?
You should import sale records, normalize data fields like acreage and improvements, apply adjustment factors for location or access, and calculate a weighted average price per acre so you can justify your offer with transparent comparables analysis.
Gathering Sale Data
Download CSV exports from MLS or county records. Ensure each entry includes sale date, price, size, and any amenities or water frontage details.
Adjusting for Variables
Create columns for adjustment percentages—for example 10 percent discount for lack of road access, or 5 percent premium for utility hookups. Multiply base price per acre by these factors.
Price-per-Acre Metrics
Divide adjusted sale price by acreage for each comp. Use Excel’s AVERAGE or AVERAGEIFS functions to compute an overall benchmark value based on your selection criteria.
How do I use a Google Sheets land flip calculator?
You should import the template into Google Drive, grant collaboration permissions, then update input cells with deal specifics so real-time edits reflect across all team members and you can access the model anywhere without software constraints.
Importing the Template
Open the shared Google Sheets link and choose File > Make a Copy. Rename and move the copy into your Drive folder for project organization.
Collaborating in Real Time
Share edit or comment access with partners or advisors. Use comments or built-in version history to track changes and revert to prior iterations if needed.
Publishing Results
Use Google Sheets’ chart tools to visualize IRR, profit, and expense breakdown. Embed charts in presentations or export as PDF for lender packets and investor reports.
How should I track my land flip pipeline?
You should create a table with columns for deal name, stage, key dates, contact information, and status notes, then use conditional formatting and pivot tables so you can monitor progress, deadlines, and conversion rates at a glance.
Deal Stages Definition
Define stages such as Lead, Under Contract, Due Diligence, Funding, Closed, and Post-Close. Assign each deal a stage to standardize tracking.
Status and Deadline Fields
Include columns for next action, responsible party, and deadline date. Use date functions to flag upcoming or overdue tasks.
KPI Dashboards
Build pivot tables or summary sheets that display counts by stage, average time in stage, and win rates. Add sparklines or conditional formatting to highlight high-priority deals.
How do I apply an offer formula calculator to land deals?
You should identify variables such as ARV multipliers, holding costs, desired return, and risk premiums, then plug them into the offer formula cells so you can instantly generate a maximum allowable offer that fits your investment criteria.
Understanding Offer Formula Variables
List factors like after-repair value, seller concessions, holding costs per month, and minimum profit margin. Define each variable in a dedicated cell for clarity.
Inputting Comparable Data
Enter your adjusted price-per-acre comparables and expected sale price. Link these cells to the formula so offer recommendations update dynamically.
Generating Target Offer
Use the formula target = (ExpectedSalePrice – TotalHoldingCost – DesiredProfit) ÷ AdjustedAcres. Review the result and run sensitivity analyses on key inputs to test deal robustness.
Mini FAQ
Which calculator should I start with as a beginner?
Begin with a basic ROI calculator that covers purchase, holding costs, and sale proceeds. As you gain experience, add tax estimators and pipeline trackers.
Can I use the same spreadsheet for multiple deals?
Yes. Create a master template with clear input sections. For each new deal, copy the template to preserve formulas and historical data.
How accurate are online land tax calculators?
Accuracy depends on the quality of assessment values and tax rate inputs. Always verify rates with your local assessor and review final bills for adjustments.
What is the difference between IRR and cash‐on‐cash return?
IRR measures annualized growth rate over the holding period. Cash‐on‐cash return shows how quickly you recoup actual cash invested, focusing on first‐year performance.
How often should I update my pipeline tracker?
Update status fields and deadlines weekly to maintain current visibility. Use automated date checks to flag stale or overdue deals.


